10 Essential Financial KPIs Every Business Owner Should Track
You cannot improve what you do not measure. Yet most business owners track revenue and little else. While revenue is important, it tells only part of the story. Understanding the key financial metrics that drive your business is what separates thriving companies from those that struggle.
Here are 10 essential financial KPIs every business owner should track — and how to use them to make better decisions.
1. Gross Profit Margin
Gross Profit Margin = (Revenue - Cost of Goods Sold) / Revenue × 100
This metric tells you how efficiently you produce your product or service. A declining margin suggests rising input costs or pricing pressure. Track it monthly and investigate any drop of more than 2 percentage points.
2. Net Profit Margin
Net Profit Margin = Net Profit / Revenue × 100
This is your bottom line after all expenses. A healthy net margin varies by industry, but anything below 5% warrants a close look at your cost structure. Compare your margin to industry benchmarks.
3. Current Ratio
Current Ratio = Current Assets / Current Liabilities
A measure of liquidity. A ratio above 1.5 indicates you can meet short-term obligations comfortably. Below 1.0 signals potential cash flow problems. Track this monthly to avoid liquidity surprises.
4. Accounts Receivable Turnover
AR Turnover = Net Credit Sales / Average Accounts Receivable
This shows how efficiently you collect payments. A low ratio means customers are slow to pay, tying up your cash. If your terms are net 30, you want your AR turnover to be around 12 (meaning invoices are collected in roughly 30 days).
5. Cash Conversion Cycle
CCC = Days Inventory Outstanding + Days Sales Outstanding - Days Payables Outstanding
The ultimate efficiency metric. It measures how many days cash is tied up in your operations. A shorter cycle means your business generates cash faster. Aim to reduce this number year over year.
6. Burn Rate
Especially critical for startups and growth companies. Burn rate is the rate at which you spend cash each month. If you are not yet profitable, divide your cash reserves by your burn rate to understand your runway — the number of months you can operate before needing additional funding.
7. Customer Acquisition Cost (CAC)
CAC = Total Sales & Marketing Costs / Number of New Customers Acquired
How much does it cost to win a new customer? Track this by channel to see which marketing investments actually pay off. If your CAC exceeds your average customer lifetime value, your business model needs attention.
8. Customer Lifetime Value (LTV)
LTV = Average Purchase Value × Average Purchase Frequency × Average Customer Lifespan
The holy grail metric. LTV tells you how much revenue a typical customer generates over their entire relationship with your business. A healthy LTV-to-CAC ratio is 3:1 or higher.
9. Operating Expense Ratio
Operating Expense Ratio = Total Operating Expenses / Gross Revenue
This shows how efficiently you run your business. A rising ratio indicates costs are growing faster than revenue — a warning sign that needs attention. Track by department to identify where costs are climbing.
10. EBITDA
Earnings Before Interest, Taxes, Depreciation, and Amortization. This is the most commonly used proxy for operating cash flow. Investors and lenders will ask for it. A healthy EBITDA margin (15% or higher for most industries) signals a fundamentally sound business.
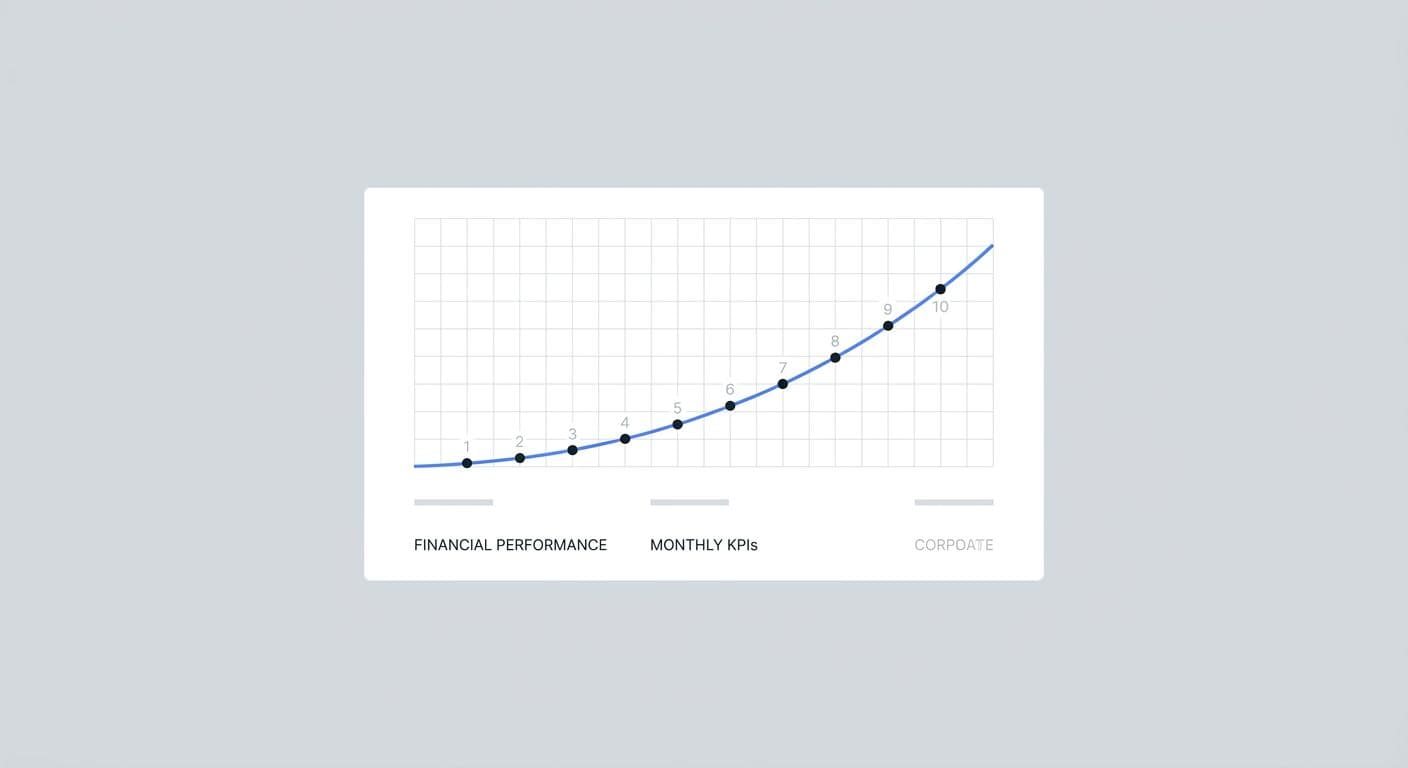
How to Start Tracking KPIs
You do not need complex software to start. A simple dashboard in Excel or Google Sheets updated monthly is enough. The key is consistency — track the same metrics the same way each month so you can spot trends and take action before small problems become big ones.
How Uzair Khalid & Co Can Help
We help businesses design and implement financial reporting systems that deliver the KPIs that matter. From dashboard setup to monthly FP&A support, our team ensures you always know the story behind your numbers.
Contact us to transform your financial reporting.